Eugene Bogomazov from Qrator Labs presented a paper during the African Peering and Interconnection Forum that took place on August 23, 2022. The paper highlights the results and conclusions of measurements taken from several networks in African countries. We publish these results here through this blog.
In this research, Qrator. Radar team evaluated the African Internet segment and its current state: how many ISPs operate in the region and their state of affairs. Also, research highlights routing security metrics, as well as transit reliability.
First of all - why do we care? I work for Qrator Labs, a DDoS attacks mitigation company, and we have our own BGP anycast network. Also, I represent the Qrator. Radar project, where we have a BGP collector with more than 800 points of presence - so we have the BGP data to create a BGP monitoring tool, and also it allows us to conduct further network research.
View the full presentation of the paper here.
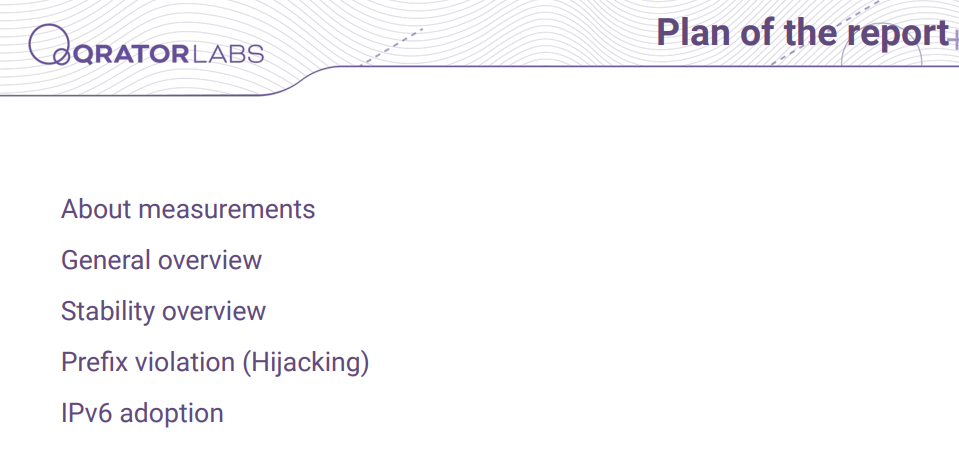
What will this presentation be about? First, we will discuss our measurements: what and how we are trying to measure.
Then we'll look at a few simple yet powerful general metrics we've chosen to highlight. After that, we will consider the specific metrics of the stability of the region's network in the event of a single point of failure. Later we will discuss some of the BGP incidents, particularly how often BGP attackers violate your address space. Finally, we will try to figure out what happens when you enter the IPv6 world.
First, let's talk about what we are trying to measure.
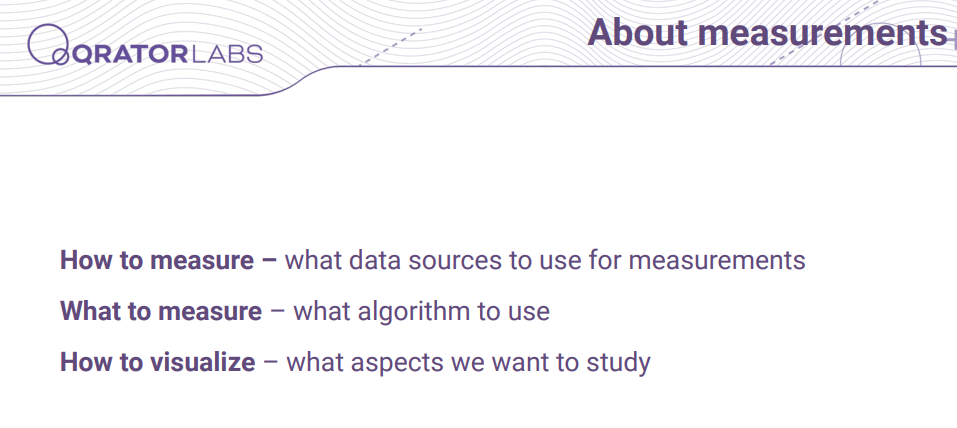
Our measurements consist of separate parts. First, we discuss what data sources we are using; second, we discuss what algorithm we are using and what the pitfalls are that could happen, and we will show the results of some of those pitfalls. And finally, we will visualize our findings.
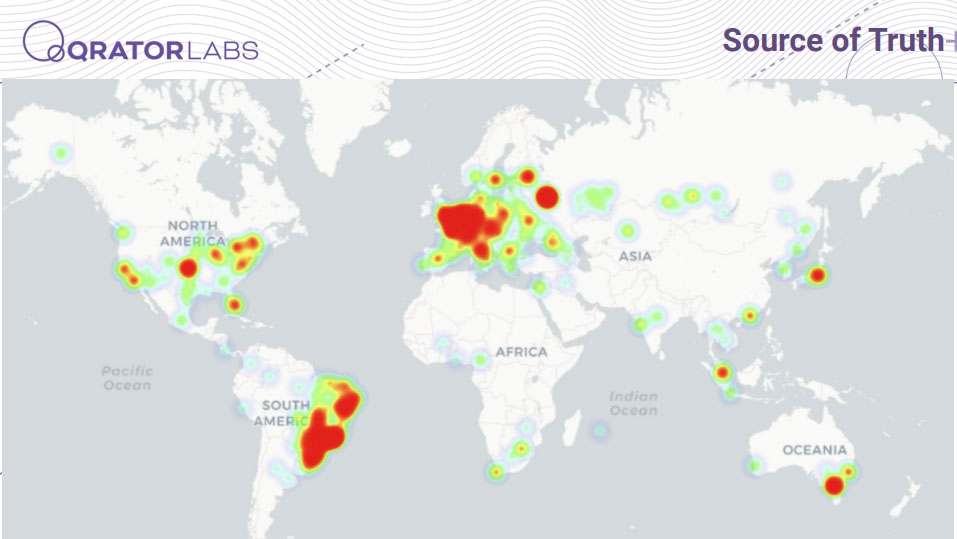
As I mentioned, we have our own BGP collector, and you can see all our observation points on this heatmap. This BGP data is the primary source which allows us to make conclusions and conduct research. And I think you already see a little problem with this map - even if we have several hundreds of BGP sessions, we have only 15 observation points in Africa.
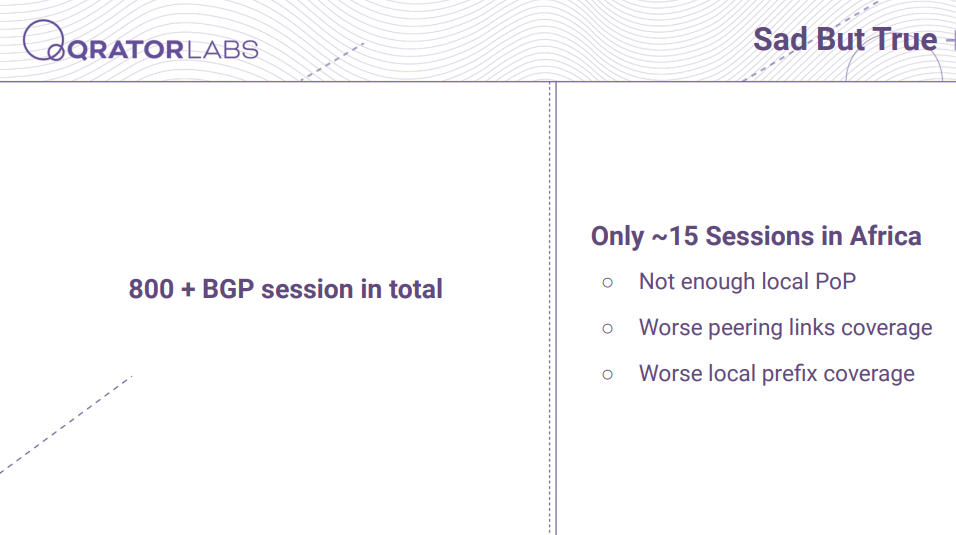
So, what is the problem? In Africa, there are around 50 IXPs, and many local routes can be seen only on these IXes; they don't traverse to the Tier-1s and, therefore, to different parts of the world. We (in Qrator.Radar) can't see these routes as we don't see local peering and thus do not consider such peering links at the later steps.
But we could use what we have, and so we will use related data from other parts of the world.
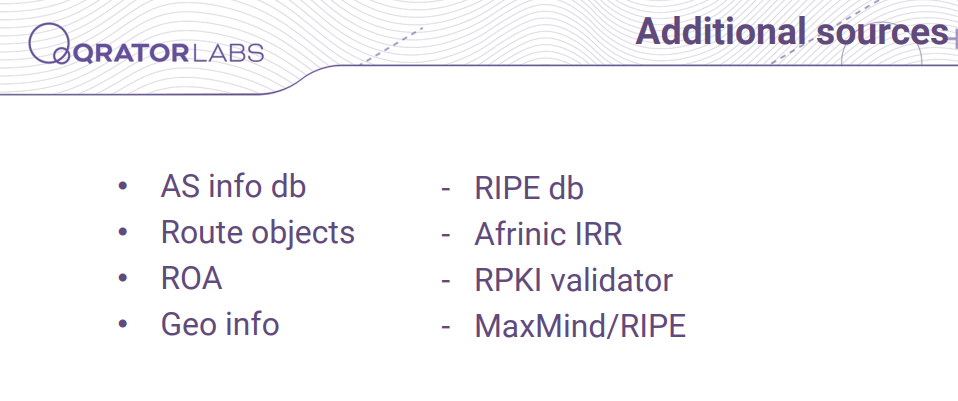
Also, when talking about BGP data, we see prefixes and AS paths. So, to get a description of ASNs, we use IRR databases. To obtain information about to which country a given ASN or prefix belongs, we use geo community services such as MaxMind and others. And when we are talking about prefix violations, there are two types of objects indicating legitimate owners of the address spaces: Afrinic IRR for route objects and RPKI storage for RPKI/ROA objects.
When we talk about ranking, we have a problem. Because the network is a graph, there are too many ways to figure out which nodes in the graph are important. Therefore, we need to find a subset of these metrics, that is, from one point of view, simple enough to understand but, from another point of view, powerful enough to describe what is happening with the region as a whole.
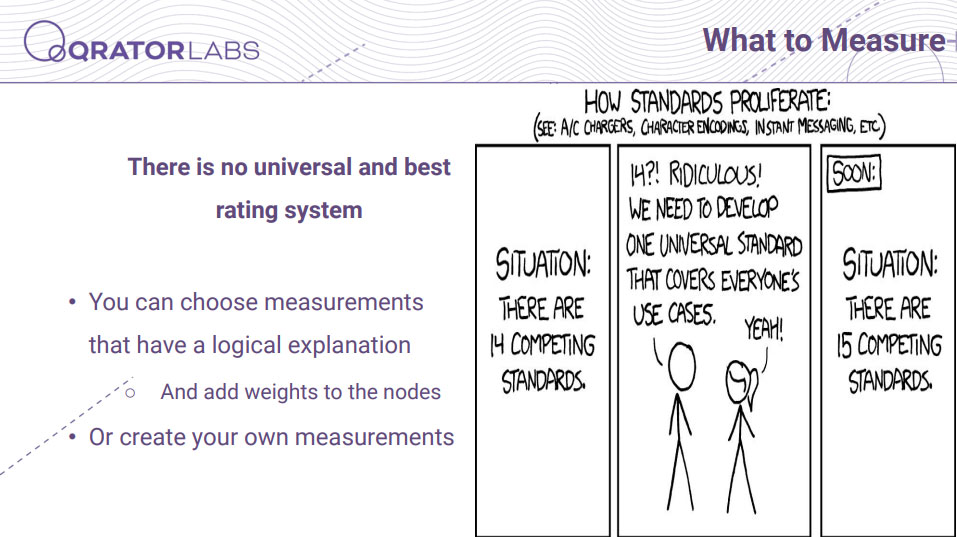
First, we'll look at the most common ones, present our metrics, and describe what they are measuring and why they are essential.
Let’s take a look at the general metrics.
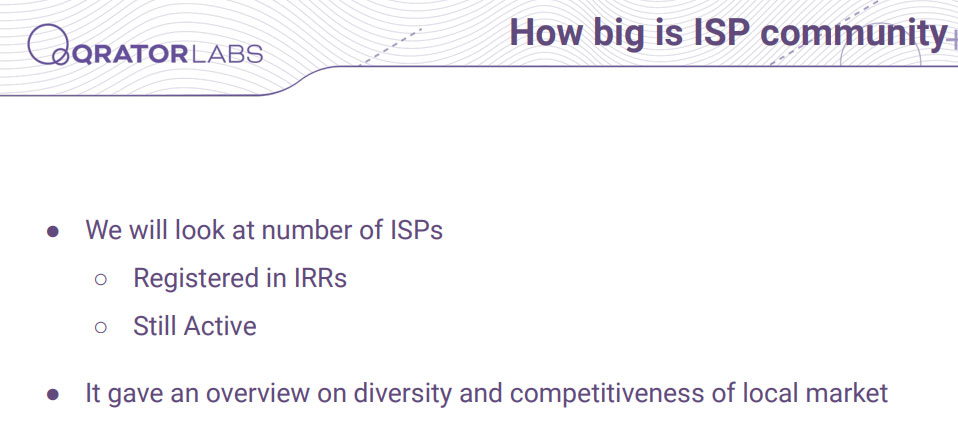
When talking about what is happening in a region, the first question that comes to mind is how many ISPs are there in a country or region. You can obtain this metric from different angles. First, you can find out how many ASNs are registered in the Afrinic IRR or, for example, gather all BGP routes, correlate how many of them are being announced by local ISPs and thus find out how many of them are alive.
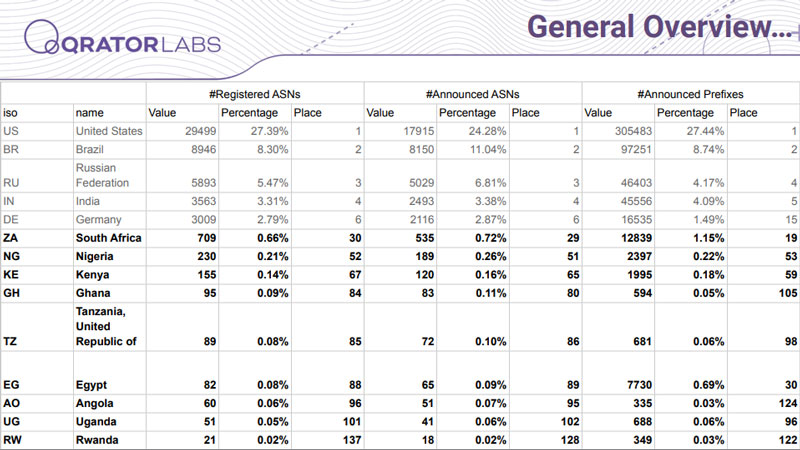
Here you can see statistics on the registered ASNs, announced ASNs and announced prefixes.
Looking at the results, we can find that South Africa, Nigeria and Kenya came out on top by a significant margin. It was already said at this conference what the reasons are: in these countries, there is a growing market, and over the past few years, there have been many new operators trying to provide their services in these countries.
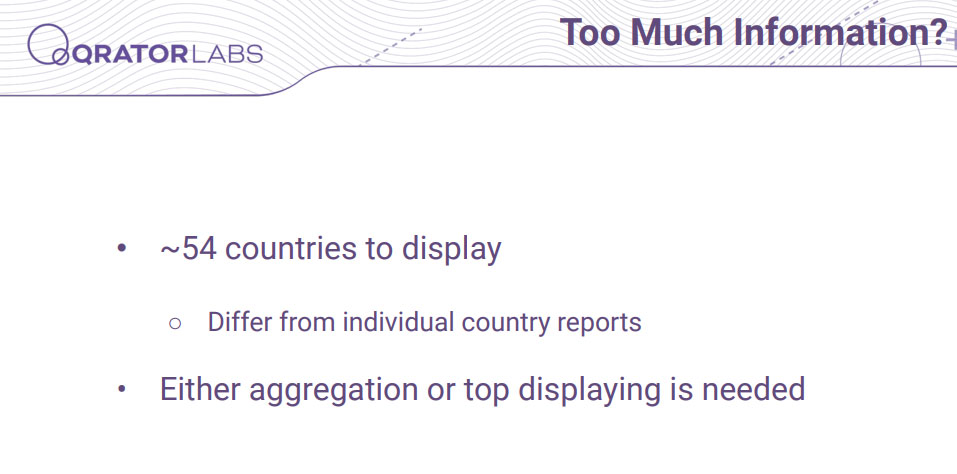
But there are 54 countries to display, so how do we decide which subset of the total data we want to show? So, for the rest of this presentation, we'll talk about countries that rank in the top or median places, emphasizing how a region ranks in this indicator.
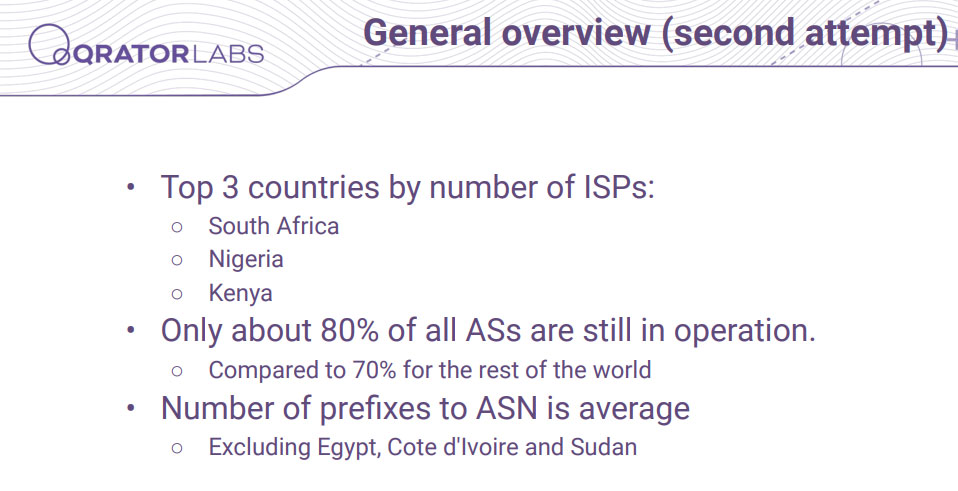
Also, I want to highlight that the above top 3 countries have more than half of all ISPs in the region. So when something happens with these countries, it could affect the region and thus influence the whole continent.
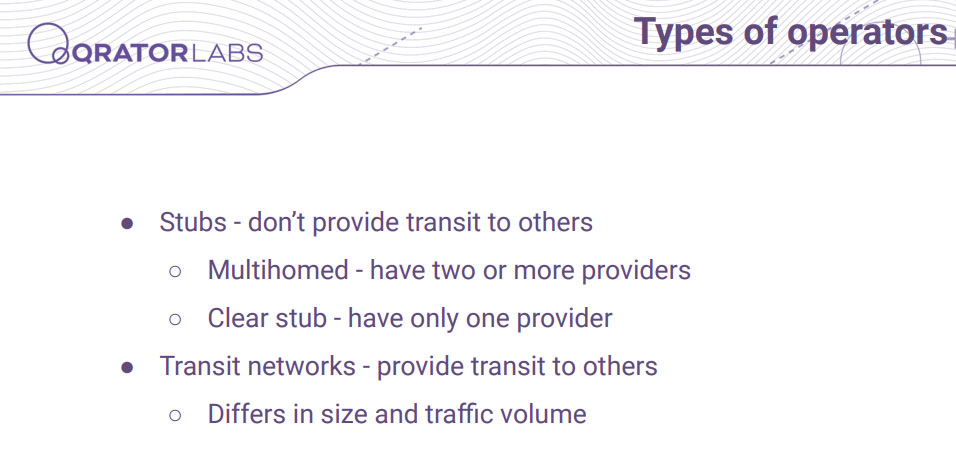
We looked at the total number of ISPs, but ISPs can vary and play different roles. First, as an operator, you can create your own ASN to provide local services to your local customers/users, such as banks, universities, or any other organization. You have to buy a network prefix, announce it, and don't care how the network works. And there is another part, a specific role - the transit network, whose task is to connect these local operators with the rest of the world.
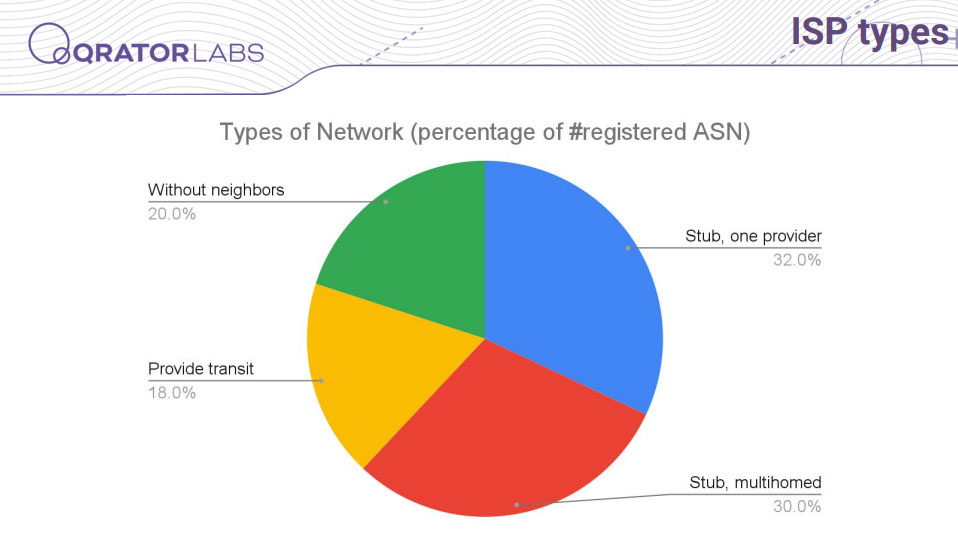
Let's take a look at the pie chart, with the help of which we will find out that the first type of operator is the most common. They occupy ¾ of all the active ISP's space. So the number of transit operators is relatively tiny, but they play a massive part in Internet health.
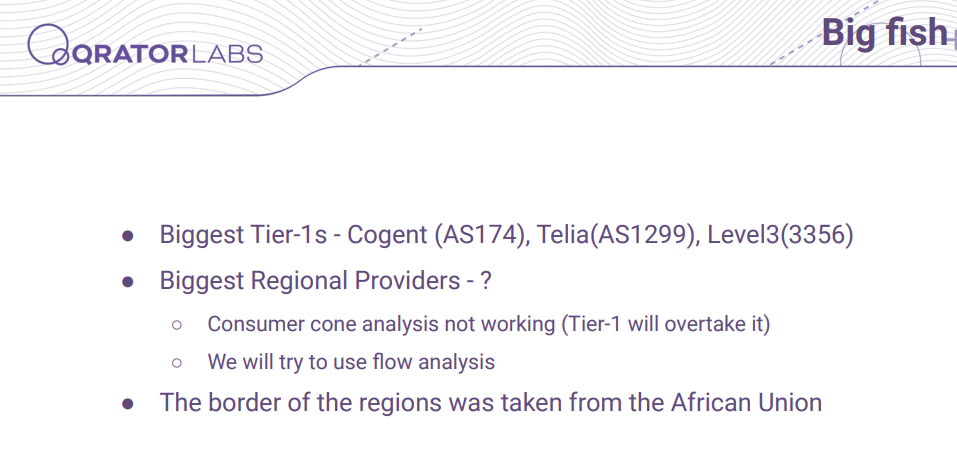
Who are the most significant transit operators on the continent? Of course, we got to name some of the Tier-1s: Cogent with a considerable lead, then Telia and Level3. But we cannot look exclusively at the Tier-1s, some big Tier-2 operators interconnect the region from the inside, and they cannot be found by a consumer cone or a similar metric. So we need to design our own metric to highlight how they are critical to the region.
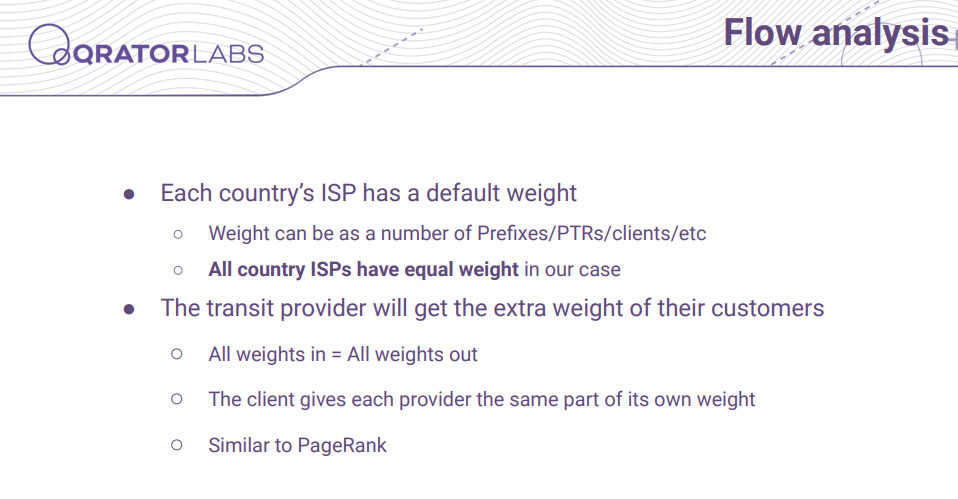
So, to create a new metric, we will make two assumptions. First, we will consider all of the country's ASNs equal and give them a similar weight. And the second assumption is that the transit provider equally distributes all of his weight to all outgoing provider sessions. So everything is equal, and providers are identical, which is simple enough. And now, let's take a look at what result these assumptions give us.
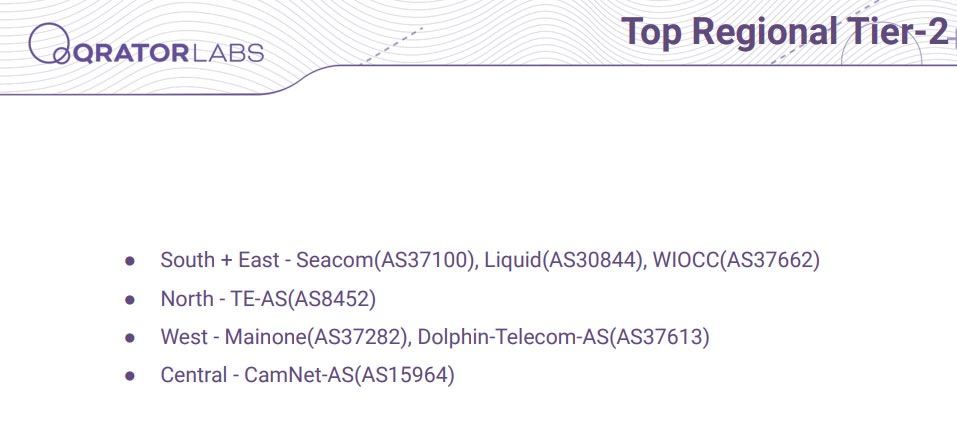
Of course, we will see Seacom, which provides cable interconnection in Southern and East Africa. Liquid technologies, a participant at AfPIF (and the only company connected West to East by land) and West Indian Ocean Cable Company - WIOCC.
In the West, Mainone takes the lead with Dolphin Telecom.
A particularly interesting situation exists in the Northern and Central parts of Africa. Because Egypt and Cameroon are a big part of the Northern and Central regions, these countries' most significant transit operators automatically became the region's biggest transit operators.
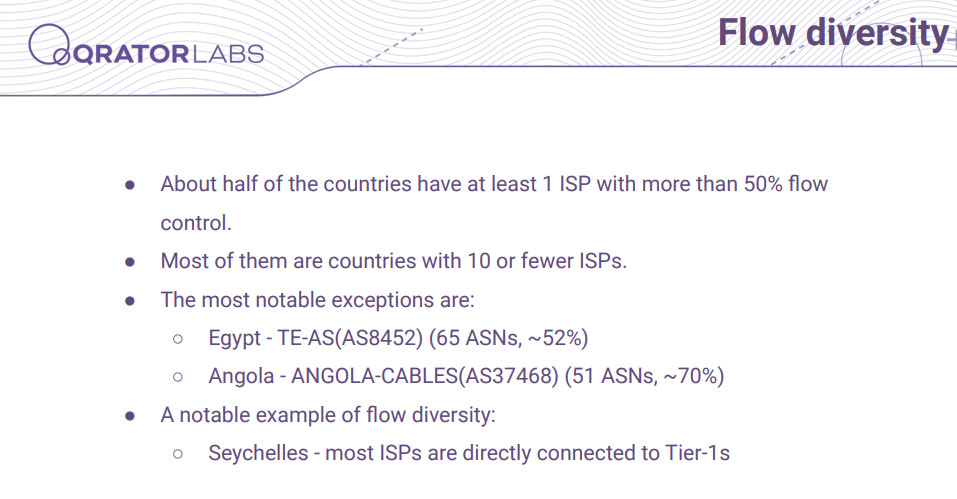
What about other countries? Most African countries have 10 or fewer active ISPs. That is why you can always find one transit operator that will control more than half of the whole traffic for a given country. The most notable exceptions are Egypt and Angola with Angola Cables ISP.
On the other hand, there are Seychelles, whose ISPs are directly connected to the Tier-1s. And none of the Seychelles ISPs has more than 10% of the country’s traffic under control.